You Waited Minus 98 Milliseconds
Google's web-vitals was reporting that users waited a negative amount of time for their clicks to be handled — and the three numbers still added up perfectly, which is exactly why nobody had noticed. Finding it, proving it when automated tests physically couldn't, and the exchange where a maintainer's simpler fix turned out not to work.

Syed Suhail Ahmed
Aug 27, 20267 min read
A performance library was reporting that a user waited minus 98 milliseconds for a click to be handled.
Negative time is a good bug. There's no arguing about whether it's a problem, no "well, it depends on your setup." Somebody's dashboard was showing a wait that finished before it started. This one took a day to find and a day to merge, and along the way a maintainer told me my fix wasn't needed — and was right about the reason, but wrong about the outcome. Proving that politely turned out to be the interesting part.
What INP measures
INP — Interaction to Next Paint — is how long your page takes to visibly respond after someone interacts with it. You click, and INP is the time until you actually see something happen. It's one of Google's Core Web Vitals, so it's a number a lot of teams watch closely.
Knowing the total isn't very useful on its own, so web-vitals also breaks it into three parts:
Input delay — the browser was busy with something else, so your click sat in a queue waiting its turn.
Processing duration — your click handler actually running.
Presentation delay — the browser drawing the result on screen.
That split is the whole point of attribution. It tells you which of the three to go and fix. And the first one was coming out negative.
Why it happened
To work out where processing began, the library groups together every event that got painted in the same frame — anything within 8ms of each other — and takes the earliest processing start in that group.
Grouping is deliberate and correct. The problem is what ends up in the group. It isn't limited to your interaction. Any event painted in that frame joins it, including events that were never part of your click at all.
The most realistic way to trigger it: a slow hover handler. You move the mouse over a button, its pointerover handler starts doing something heavy, and while that's still running you click. The browser reports that hover event too, and it started earlier than your click — so the group's "earliest processing start" comes from the hover, not the click.
Then input delay is calculated as processing start minus when the click happened. If processing "started" before the click existed, you get a negative number.
It's like timing how long you waited in a queue, but using the clock-in time of the person who was already at the counter when you walked in. The answer comes out as "you waited minus 98 milliseconds."
And the same 98ms didn't vanish — it got added to processing duration instead. So the breakdown blamed handler code for time the user actually spent waiting, which is exactly the wrong advice to hand a developer looking at a dashboard.
Why nobody had noticed
Because the three parts still added up perfectly to the total INP.
One went down by 98, the other went up by 98, and the sum stayed exactly right. Nothing looked broken. There was no contradiction to trip over, no assertion to fail — just three numbers that were individually wrong and collectively convincing. You'd only catch it by noticing a minus sign in a chart and being bothered enough to chase it.
Proving it was annoying
I couldn't reproduce this with an automated browser test, and it took me a while to understand why.
When WebDriver clicks a button, it dispatches the whole click with a single hardware timestamp. The hover and the click come out sharing an identical start time — so the gap the bug needs simply can't exist. Automated input can't express "a real human clicked partway through a handler that was already running."
So I split it in two. First, real Chrome, with a button whose hover handler blocks the main thread — enough to confirm the setup is real: the hover event really is reported, it really does carry a long duration, and it really does land in the same 8ms paint window as the click. Then I took the actual shipped build of the library and fed it those two events directly, with the timings a real user would produce. That's where the -98 came out.
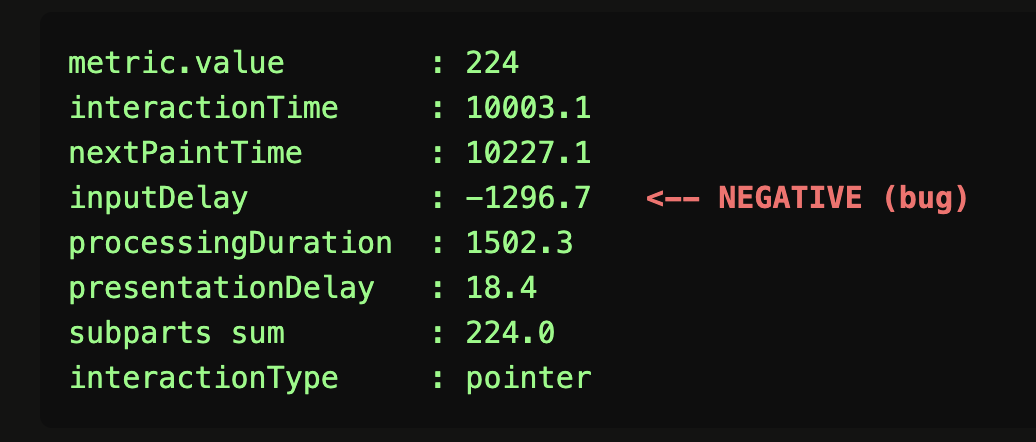
Not a simulation of the logic — the real published code, driven by hand.
The exchange that made the PR
A maintainer replied quickly with something better than agreement: he pointed at a nearby check in the code that had only ever existed to work around an old Chrome bug, fixed two years ago. Remove the dead check, he suggested, and that should solve this without needing my fix at all.
He was right that the check was dead. I confirmed it in Chrome 151 and simplified it in the PR.
But it didn't fix the bug, and I had to go back and say so. The reason is a five-line detail: the grouping runs before that check does. So every event reaches the grouping regardless — cleaning up the check changes nothing about which events end up in the group. I re-ran my repro with his suggestion applied and got the same -98.
Rather than just saying "no", I laid out the options I'd actually tested, with what each one costs — including one that fixed the number but quietly dropped events the README explicitly promises to include. He came back with the thing only a maintainer could settle: the intent of the split. Processing duration is meant to cover all handler code, including those non-interaction events. That ruled out the clever option and left the simple one.
I'm glad I asked instead of picking. My preferred fix would have been defensible and wrong.
The fix
- const processingStart = group.processingStart;
+ const processingStart = Math.max(group.processingStart, firstEntry.startTime);
In English: never let "when processing started" be earlier than the moment the user actually interacted. If a foreign event dragged the group's start time back before the click, ignore it and use the click.
The nice property is that it's a no-op when nothing's wrong. Every event belonging to your interaction starts after the interaction does, so the clamp only ever bites when something foreign pulled the number below the floor. I checked it against the case the original code was written for and the results were identical — which mattered, because that's how you show you're fixing a bug rather than reverting somebody's deliberate work.
The tests are unit tests, on purpose, and I said why in the PR: an end-to-end test physically cannot produce the input this bug needs. Worth stating out loud, otherwise "why isn't this an e2e test?" is the first question a reviewer asks.
I also flagged one thing I hadn't measured — a knock-on effect on script attribution that I'd worked out by reading the code but couldn't verify without more setup. Saying "I derived this rather than measured it" costs nothing and is a lot better than being caught assuming.
Filed on 24 August, PR the next morning, merged that evening, shipped in v6.2.1.
What I'm taking from it
Numbers that add up aren't necessarily right. The subparts summing perfectly to the total is exactly what kept this hidden. Internal consistency is not correctness.
Order of operations is a whole category of bug. Both this and the last one I filed came down to code that was individually fine, running at the wrong moment relative to something else.
When a maintainer is wrong, bring a re-run, not an opinion. "I tried your suggestion, here's the same failing output, here's the line that explains why" ends the conversation in one round. Arguing from reasoning would have taken three.
Ask about intent, don't infer it. I had a fix that produced the right number and quietly broke a documented promise. Only the maintainer could tell me which behaviour was the one that mattered.
Subscribe for new contributions
Get an email when I publish a new open-source write-up — how I approached the issue, the code, and lessons learned. No spam.