The Image That Loaded in −510 Milliseconds
How long did this image take to load? Minus 510 milliseconds. That's a real number, reported by Google's web-vitals library — the one a large chunk of the web uses to measure page…

Syed Suhail Ahmed
Oct 6, 20266 min read

How long did this image take to load?
Minus 510 milliseconds.
That's a real number, reported by Google's web-vitals library — the one a large chunk of the web uses to measure page speed. A negative duration is obviously nonsense; nothing finishes before it starts. But the interesting part isn't that it was wrong. It's that nobody made a mistake. Two people fixed two different bugs, both correctly, and the negative number fell out of the gap between them.
First, what the library is doing
LCP — Largest Contentful Paint — is the moment the biggest thing on your screen finally appears. Usually a hero image. It's the metric that best matches "has this page actually loaded yet?"
Knowing LCP was 1000ms is useful. Knowing why is more useful, so the library also breaks that time into four parts that add up to the total:
Time to first byte — how long the server took to start replying
Resource load delay — the gap before the browser started fetching the image
Resource load duration — how long the image itself took to download
Element render delay — the gap between the image arriving and it actually appearing
That breakdown is what tells you whether to fix your server, your HTML, or your image size.
The time-travel problem
Here's the design decision that sets everything up.
The library records LCP the moment it happens. But it doesn't calculate the breakdown then — that would mean doing work while the page is still loading, which is exactly when you don't want to be doing work. So it waits for the first sign the user is done: a click, a keypress, or switching tabs.
That means when it finally sits down to explain the paint, it's looking backwards at a list of network requests that has kept growing since the paint happened.
To find the image, it searched that list for a matching URL — and used findLast, which deliberately takes the most recent match.
Why "most recent" was the right choice
That looks like the bug. It isn't, and this is the part I find genuinely interesting.
findLast was added on purpose, by an earlier fix. In a single-page app, the same URL legitimately gets requested more than once as you navigate around. An old, stale entry from three navigations ago is the wrong answer. The newest one is almost always right.
Separately, a different earlier fix had capped the image's end time at the LCP moment. Also for a good reason: some media keeps downloading after it's already painted — a video streams on, a progressive image keeps refining. Without the cap, "download duration" could come out longer than the entire page load, which is its own kind of nonsense.
Two fixes. Two real bugs solved. Both correct.
Where they collide
Now put them together and request the hero image a second time, after it painted. This is extremely common:
a carousel or lazy-load library re-inserts the same
srcthe hero image is reused as a CSS background further down
a service worker revalidates it
something prefetches it
Watch what happens:
Server replies            →  100ms   (time to first byte)
Hero image requested      →  210ms
Hero image finishes       →  800ms
LCP paints                → 1000ms   ← the page is visually done
Same image requested AGAIN→ 1510ms   ← a prefetch, say
...finishes               → 1600ms
findLast does exactly what it was told and picks the second request. So the start time becomes 1510.
Then the cap does exactly what it was told and clamps the end time to the LCP moment: 1000.
duration = end − start
         = 1000 − 1510
         = −510ms
Neither rule misbehaved. The first rule assumed the matched request happened before the paint. The second rule assumed the same thing. Neither ever checked, because separately, neither had to.
And it doesn't stop at one weird number. The other parts absorb the damage: resourceLoadDelay comes out at 1410ms — larger than the entire 1000ms page load — and elementRenderDelay flattens to 0. The four parts still add up to the right total, so nothing looks internally inconsistent. The only visible symptom is a minus sign.
Worse, lcpResourceEntry — the object analytics tools read to find out which request painted the page — now points at a completely unrelated fetch. Its type, its timings, all attributed to the wrong request.
The fix
The missing rule, stated out loud: a request that started after the paint cannot be the thing that painted it.
const isLCPResource = (e) =>
  e.name === lcpEntry.url &&
  (e.requestStart || e.startTime) <= lcpEntry.startTime;
Filter to requests that started at or before the paint, then keep findLast among those. Both earlier fixes survive intact:
The same URL requested twice before the paint? Still picks the later one. ✅
Media still downloading after the paint? Still matches — because the rule checks when the request started, never when it finished. ✅
That second line is the whole trick, and it's why the comment in the shipped code spells it out. Checking responseEnd instead would have "fixed" this bug by breaking the older one.
The side quest: disagreeing with a maintainer
While writing this up I also flagged an existing test that looked wrong — it had two commented-out lines that seemed load-bearing.
The maintainer disagreed, plainly:
I don't agree the test is wrong though. It seems to be testing what it's supposed to.
He had every reason to be right. He maintains the library; I'd been reading it for two weeks.
So instead of arguing, I ran all four combinations and posted the grid:
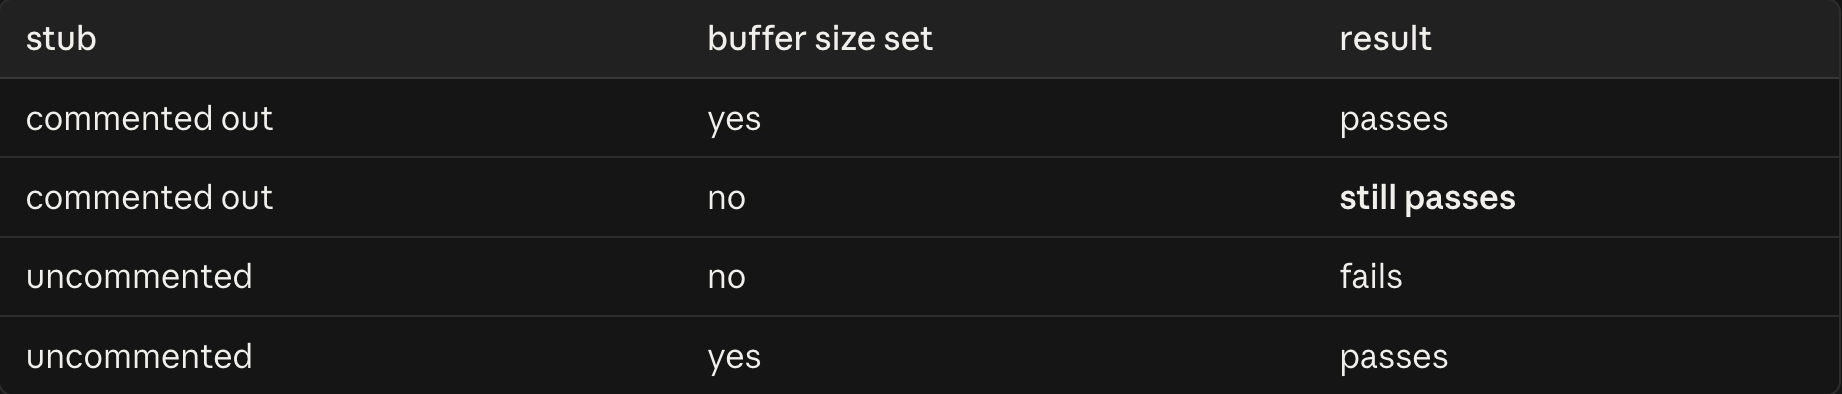
Row two is the whole argument. With the stub off, the test passed whether or not the setting under test was applied — so it wasn't actually testing that setting at all.
Ah you're right, the test was wrong. I've fixed it in #800.
Three rows of a table did what a paragraph of argument wouldn't have. It also wasn't adversarial — he fixed it himself, in his own PR, before mine landed.
What I took away
A bug can be the space between two correct fixes. Neither change was wrong. The defect lived in an assumption they both quietly made and neither stated. When you're reading unfamiliar code, the comments tell you what each line does — they rarely tell you what it's assuming.
If you measure something later than it happened, you're doing time travel. The whole bug comes from computing an explanation at a moment when the evidence has moved on. Any "look back and figure out what happened" code needs to ask whether the thing it found could even have been involved.
Before you change a line, find out why it exists. The naive fix here — also check that the download finished before the paint — looks tighter and would have silently re-broken a bug fixed years earlier. git log on the line you're about to change is five seconds well spent.
When you disagree with a maintainer, bring a table. Not a longer argument — a result they can reproduce. It converts a difference of opinion into a thing that's simply true, and it lets the other person change their mind without it being a loss.
The fix is merged in PR #803, from issue #790.
Subscribe for new contributions
Get an email when I publish a new open-source write-up — how I approached the issue, the code, and lessons learned. No spam.